Overview
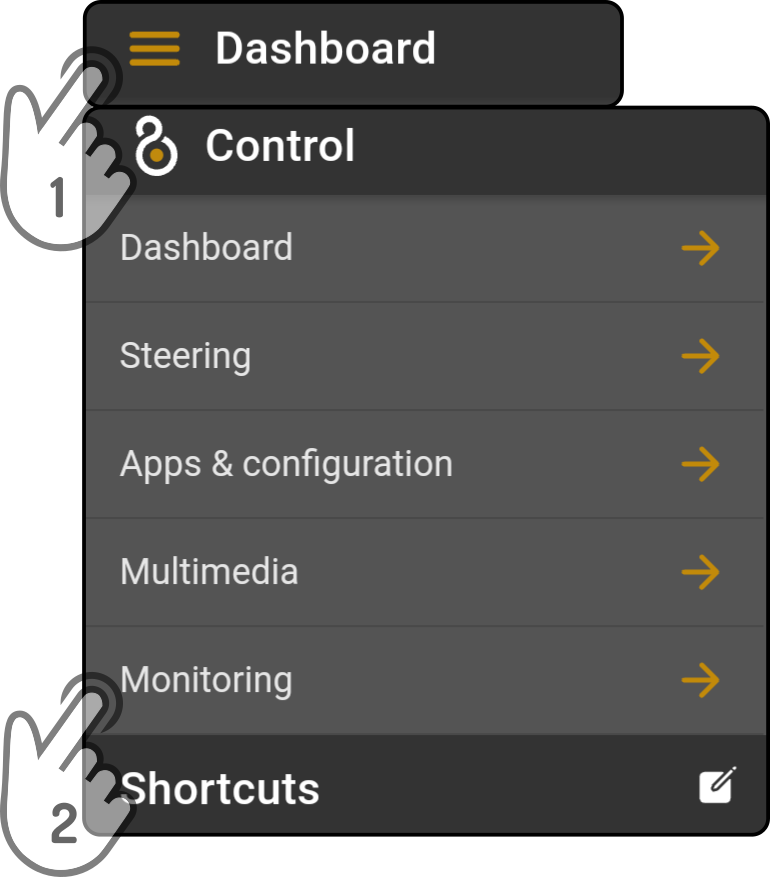
Connect Control to the device where the events were triggered and tap the option 'Monitoring' in the menu:
Select which events to show
Monitoring events can be registered in two different ways, specifically: - On the device itself (local events) - On the Cloud (Cloud events)
By default, the monitoring page will use the Cloud configuration to view events. The monitoring page will display the following page when the user isn’t logged in:
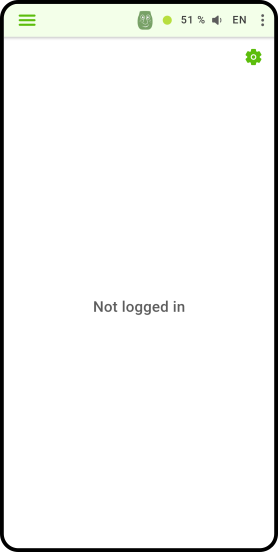
-
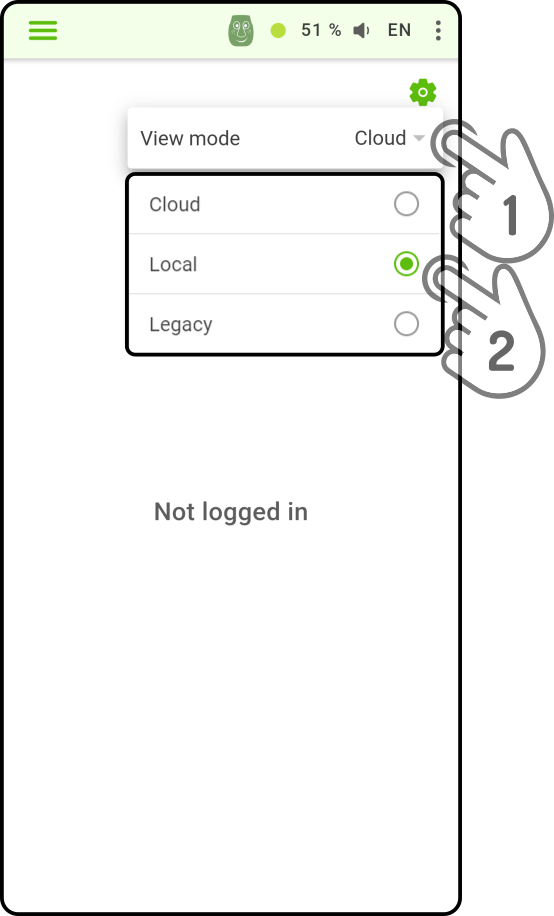
Tap the icon in the top right corner to display the available options.
-
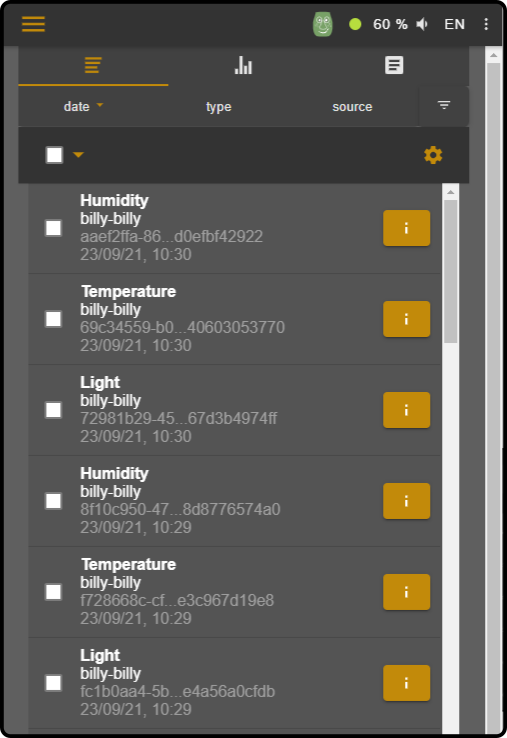
Tap the option 'Local' to view the local events for the connected device.
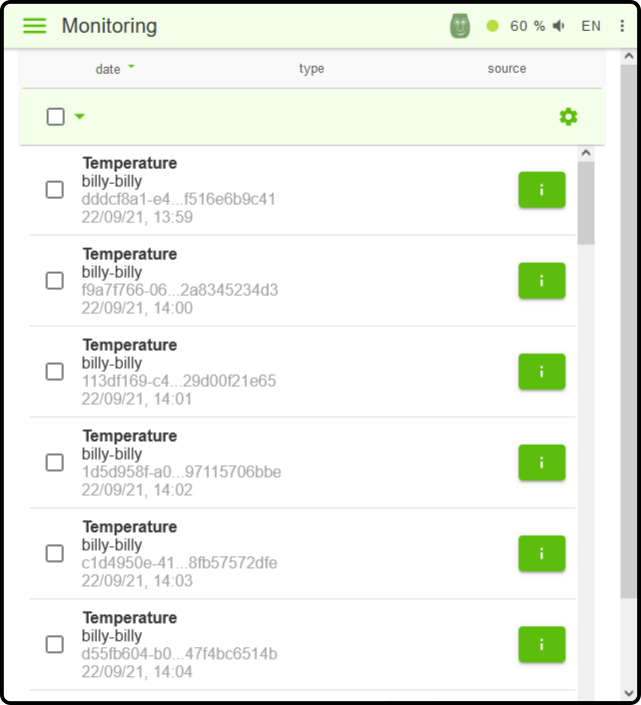
Local events can only be shown in a list and only for the connected device. For example:
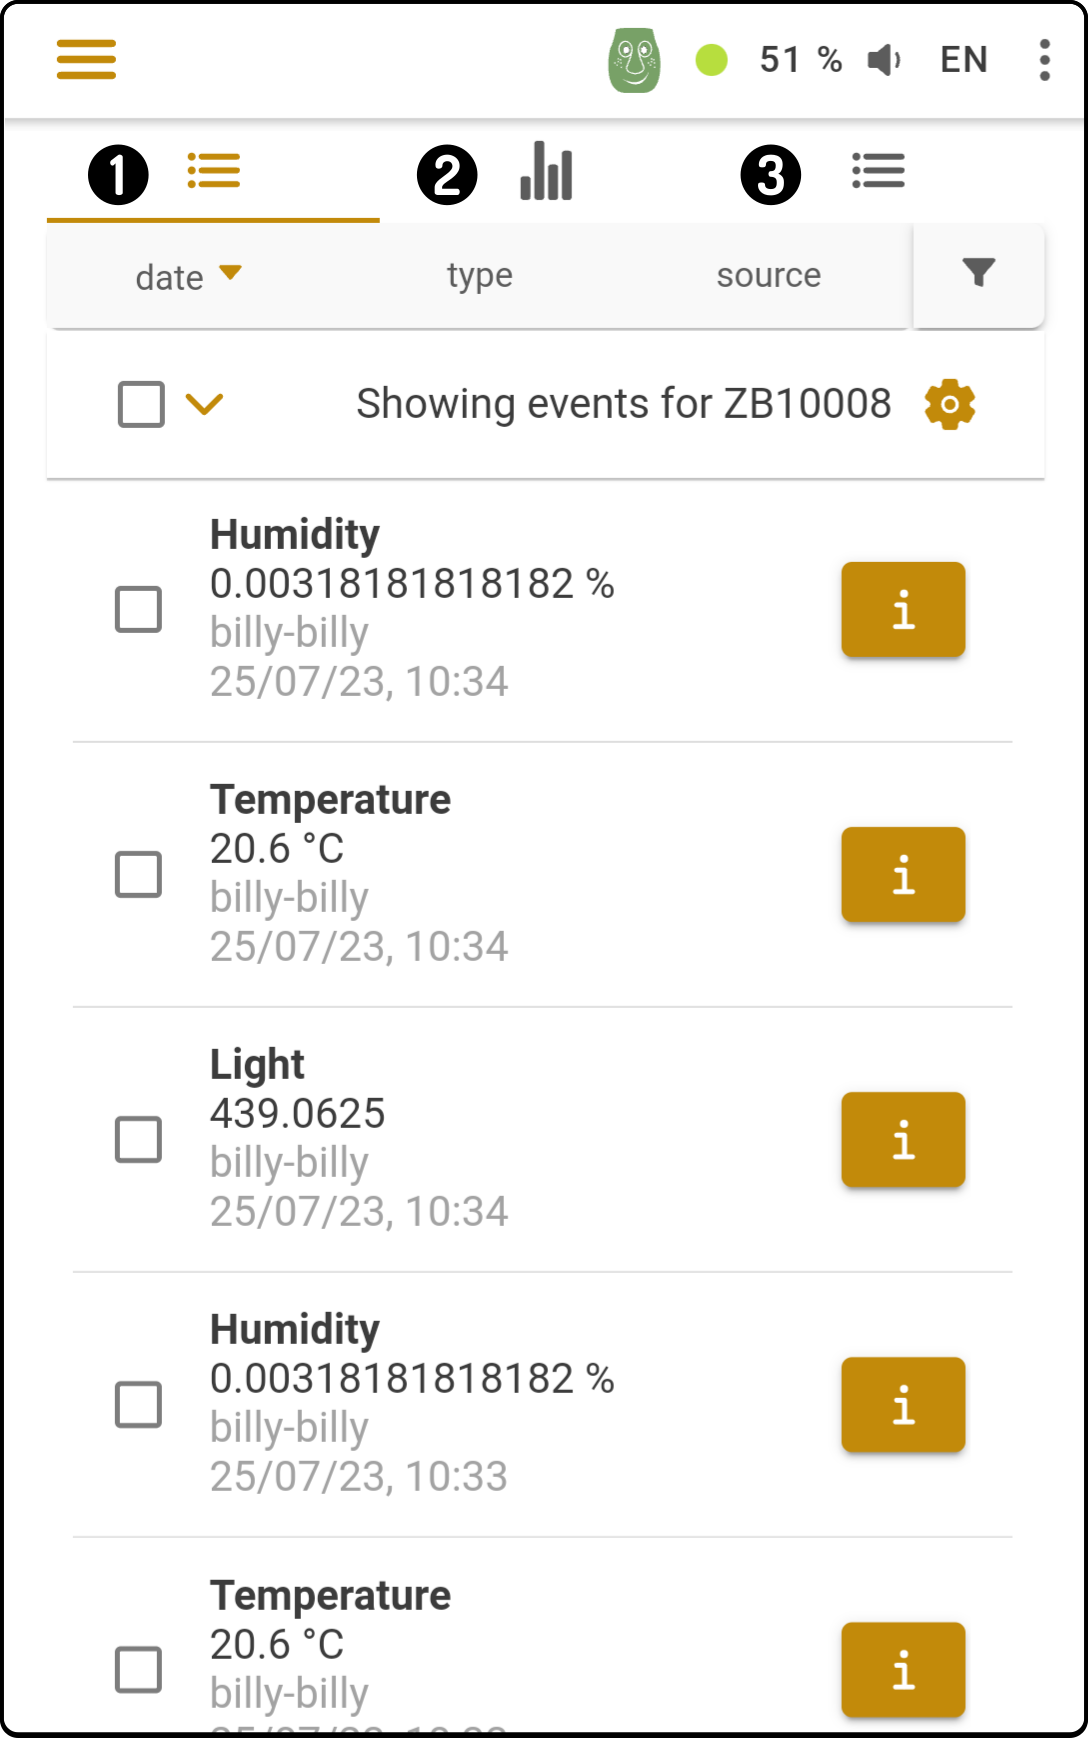
Cloud events can be shown in a list containing one or more device(s), a graph or summaries can be generated for a time period. For example:
| The option to log events in the cloud must be enabled in the Monitoring section of the Apps & Config page. |
Select display type
When connected to the Cloud, the following options will be shown on the monitoring page:
-
Tap the icon in the first tab to display the list of events registered on the ZBOS Cloud.
-
Tap the
 icon to generate a graph for events registered on the Cloud.
 -
Tap the icon in the third tab to display a summary of recent events registered on the Cloud.