Graphs
| This option will only be available for events registered in the cloud when connected to the device via the cloud. |
Two steps are required to create a graph for events registered in the cloud:
-
Select the type of graph to be generated.
-
Select the events to be used as the dataset for the graph.
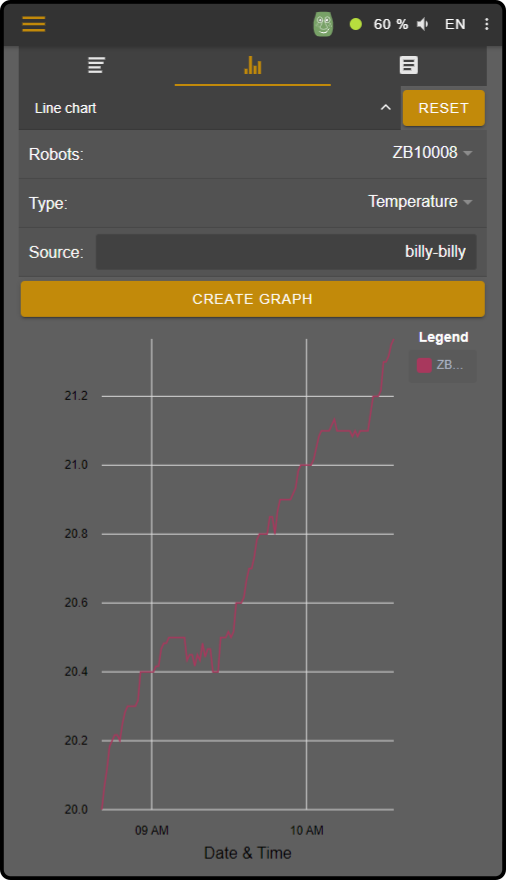
After entering both datasets, the graph will be generated. See result for an example.
Select graph type
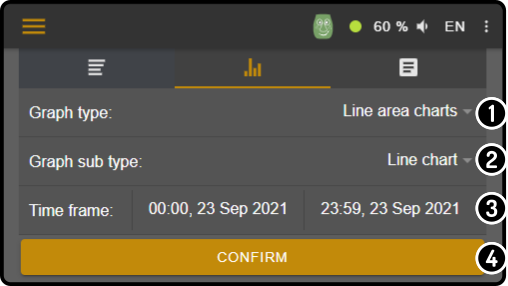
Tap the second tab on the monitoring page to view the options for the type of graph to be generated:
-
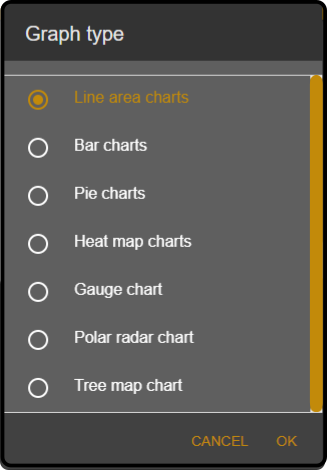
Tap the option 'Graph type' to view and select one of the available graph types:
-
Enter the subtype of the graph to be shown (e.g. 'Line chart', 'Area chart', etc.).
-
Enter the timeframe for the graph.
-
Tap the button 'Confirm' to select which events should be used as data for the graph.
Select events
-
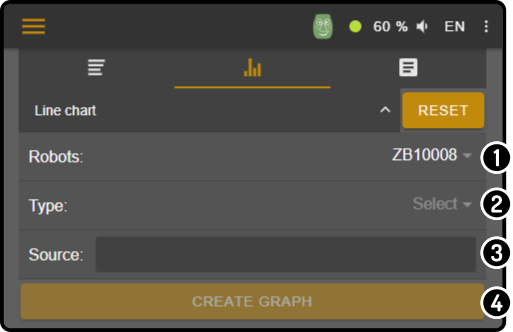
Select the device to view the graph from.
-
Select the type of event which should be drawn:
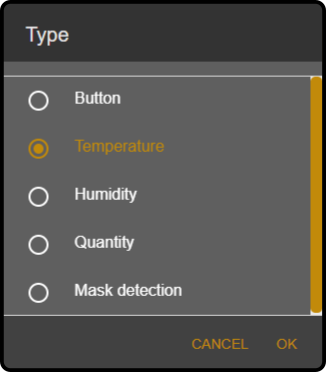
-
Enter the source (sensor) that recorded the event.
View the detailed view of an event for more details on the available source(s). -
Tap the button 'Confirm' to create the graph.
| Tap the option 'Reset' to re-select the type of graph and/or the timeframe of the graph. s Both source and event type are required to be entered before the confirm button will be enabled. |